
admin | Apr. 12, 2017
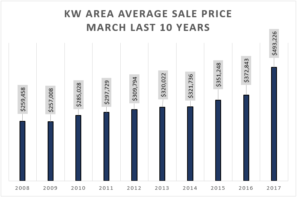
I’ve become accustomed to the prices homes are selling for – average prices of homes are up in KW 32.3% versus March 2016…well of course they are. I’m actually more shocked these days when a home doesn’t sell for a great price. Which actually means that a “great price” is the new normal price. Right?
The market has taken us by storm. We didn’t expect this. We’ve been accustomed to the status quo. And then we became famous. We are “KWollywood” now – that’s KW and Hollywood done like they do with famous couple’s names. We are Britney Spears in 2000 – Don’t shave your head; rather keep it firmly on and adjust to the new normal. There have been enough sales over the last 16 months to provide us with data on real estate values. So, I’ve retired the term “crazy” when talking about our KW real estate market and now apply it only to those instances where I see a home sell for less than its full potential and the Buyer got a “crazy” deal and the Seller was “crazy” to sell so low.
AVERAGE HOME PRICE: $493,226 UP 32.3%
SINGLE DETACHED AVERAGE PRICE: $583,144 UP 35.6%
APARTMENT STYLE CONDO AVERAGE PRICE: $265,524 UP 25.4%
TOWN HOUSE AVERAGE PRICE: $368,554 UP 29.9%
SEMI DETACHED AVERAGE PRICE: $412,226 UP 49.1%
We saw 729 properties sold in March – this is the most number of homes sold in March on record! 1,532 homes have already sold year-to-date, that represents a 13.4% increase over the same period last year and 30% more than the 5-year average. We saw 844 homes listed in March which is higher than the 807 5-year average. However, demand is so strong that at the end of March there were only 434 active listings versus the 5-year average number of 1,508.
SINGLE DETACHED HOMES SOLD IN MARCH: 444 UP 15%
CONDOMINIUM PROPERTIES SOLD IN MARCH: 164 UP 49.1%
SEMI DETACHED HOMES SOLD IN MARCH: 67 UP 76.3%
FREEHOLD TOWN HOUSES SOLD IN MARCH: 48 UP 14.3%
My final word this month is that it is a great time to sell: Sellers have all the power right now and will get a great price if they do it right. In my opinion, it is an even better time to buy – even though it is tough to actually pin a home down. The up trend in KW has 16 months behind it. The trend has legs and I’m not sure what would stop or blow this trend up any time soon.
The inclination is to wait – “wait until it crashes” is what I hear a lot. But what if the market runs 60% more before it takes a dip? What if it runs up 100%! A dip in the market after a run up like that may happen, but it won’t drop 100% or even 60%, maybe it drops 20% and then you buy – great timing. But wait, you missed the 100% up and now are getting a 20% discount, so you actually missed out on 80% appreciation. And, also remember, that you aren’t alone – there will be others that want to take advantage of the 20% dip. So how long does that dip last if everyone sees the dip as value and buys it up. I think it lasts a short period, maybe 6-12 months, and we make back the 20% dip and the trend up will continue.
